
Centrifugal pump performance curves demonstrate how head, efficiency, power, and NPSH change with flow rate. Understanding these curves helps engineers select the right pump, operate it near the Best Efficiency Point (BEP), avoid cavitation, and improve system efficiency. This blog explains each curve in a simple and practical way for students and professionals.
Title :- Centrifugal Pump Performance Curves Explained
Knowing centrifugal pump performance curves is essential for selecting, operating, and troubleshooting pumps in industrial and utility applications. These curves graphically represent how a pump behaves at different flow rates (Q) and help engineers choose the right pump for a given process.
In this blog, we will break down all main pump curves :-
Head vs Flow Rate, Efficiency vs Flow Rate, Power vs Flow Rate, and NPSH vs Flow Rate with simple explanations and insights based on the reference image.
1. What Are Pump Performance Curves ?
Pump performance curves are graphical representations provided by manufacturers to show how a centrifugal pump will perform under different operating conditions. These curves help determine:
- Flow rate (Q)
- Head developed (H)
- Pump efficiency (η)
- Power consumption (P)
- NPSH required (NPSHr)
Together, these curves assist engineers to find the Best Efficiency Point (BEP) and operate pumps safely while avoiding issues like cavitation.
2. Head vs Flow Rate (H vs Q Curve) :-
The Head vs Flow Rate curve is the most essential characteristic of a centrifugal pump.
How head changes with flow :-
- H is inversely proportional to Q i.e. as head increases, flow rate decreases and as head decreases, flow rate increases.
- Relationship is usually curved, not linear.
- At zero flow or no flow (discharge), the pump develops maximum head (called shut-off head).
Shut-Off Head :-
This is the head produced by the pump when the discharge valve is completely closed (Q = 0). The pump should not be operated here for long because it can cause overheating.
3. Efficiency vs Flow Rate (η vs Q Curve) :-
Pump efficiency changes with flow rate and usually forms a bell-shaped curve.
Key Points :-
- Efficiency increases as flow rate increases.
- Reaches max efficiency (peak efficiency) at a specific operating point.
- After the peak efficiency, efficiency decreases due to hydraulic losses and flow rate increases.
Best Efficiency Point (BEP) :-
The BEP is the point where the pump operates at maximum efficiency.
Operating near BEP :-
- Reduces vibration
- Minimizes energy consumption
- Reduces wear and extends pump life
- Ensures stable operation
- Provides reliability
4. Power vs Flow Rate (P vs Q Curve) :-
Power consumption of a centrifugal pump is directly related to the flow rate.
Behavior of Power Curve :-
- P is directly proportional to Q i.e. as flow rate increases, power requirement of pump increases.
- At low flow rate, power consumption is low.
- This helps engineers size motors correctly.
Important :-
Motor rating must always be higher than the maximum power shown on the P vs Q curve to avoid overloading.
5. NPSH Required vs Flow Rate (NPSHr vs Q Curve) :-
What is NPSH ?
NPSH (Net Positive Suction Head) indicates the minimum pressure required at the pump suction to avoid cavitation.
How NPSHr changes with flow ?
- NPSH is directly proportional to Q i.e. as flow rate increases, NPSH required by pump increases.
- At high flow, suction pressure drops, increasing cavitation risk.
- If NPSH available is less than NPSH required then this causes cavitation which damages pump.
Condition to Avoid Cavitation :-
To prevent damage: NPSHa > NPSHr
Where:
NPSHa = Available NPSH from the system
NPSHr = Required NPSH by the pump
Cavitation leads to noise, efficiency loss, vibration, and severe impeller damage.
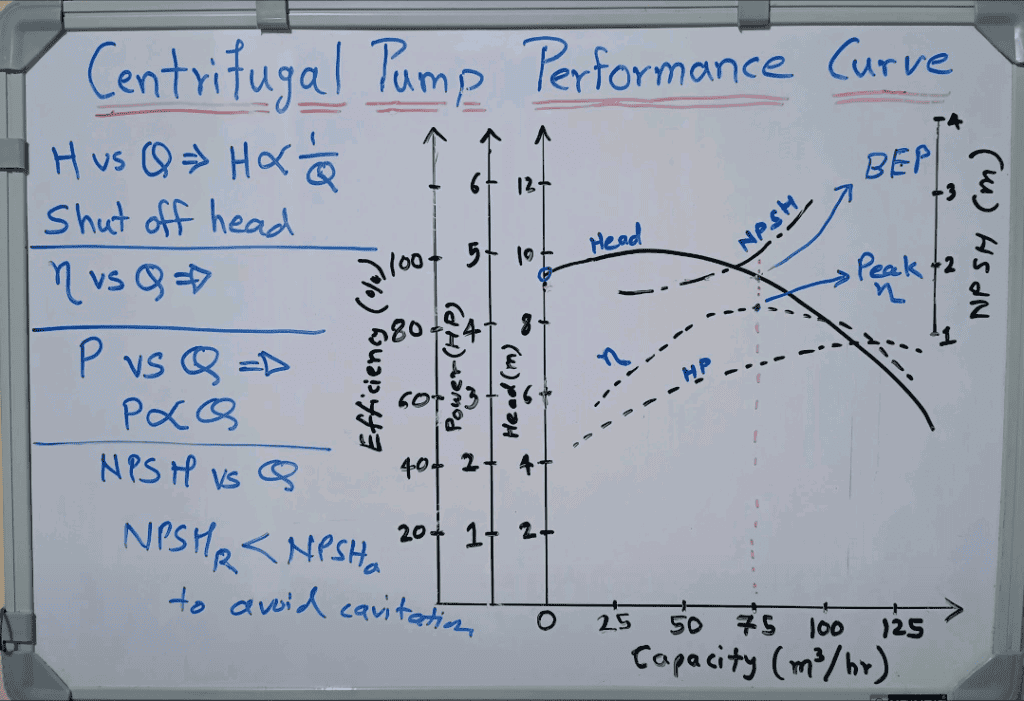
6. Putting It All Together: Understanding the Combined Curve :-
The combined performance curve like the one shown in the image :-
- H vs Q curve
- Efficiency curve (η)
- Power curve (HP)
- NPSHr curve
On the horizontal axis, we have flow rate (m³/hr), and on the vertical axesn :-
- Head (m)
- Efficiency (%)
- Power (HP)
- NPSH (m)
The intersections of these curves help determine :-
- Where the pump will naturally operate on the system
- How efficient the pump will be at that point
- Motor sizing requirements
- Cavitation risks
7. Why Pump Curves Are Important :-
Engineers rely on pump curves for :-
- Correct pump selection – Avoiding oversized or undersized pumps.
- Energy efficiency – Operating near BEP saves substantial power costs.
- Troubleshooting – Deviations from curves indicate problems like:
- Blocked pipes
- Impeller wear
- Air entrainment
- Wrong pump selection
- Avoiding cavitation – Ensuring NPSH margins are maintained.
8. Practical Tips for Engineers :-
- Always select a pump whose duty point is close to BEP.
- Ensure NPSH available (NPSHa) ≥ NPSH required (NPSHr) + safety margin.
- Never run pumps at shut-off head for a long time.
- Compare power curve to motor nameplate data before installation.
- If multiple pumps are used in parallel, evaluate combined curves.
Conclusion :-
Centrifugal pump performance curves are the most important tools for understanding how a pump behaves under different conditions. Engineers can select the right pump by interpreting Head, Efficiency, Power, and NPSH curves which ensure efficient operation, and avoid costly failures due to cavitation or motor overload.
Whether you are a student or a working professional in mechanical or process engineering, mastering pump curves is essential for designing reliable and energy efficient pumping systems.
Leave a Reply